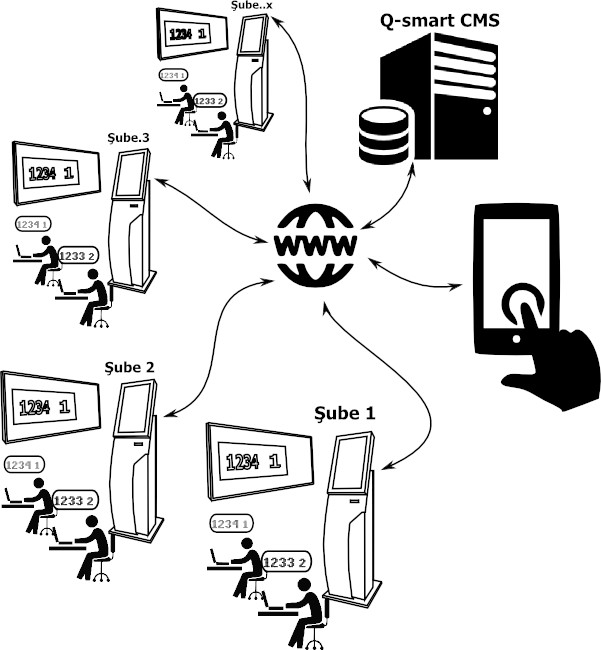
General Structure
The centralized management system includes a CMS (content management server) and the ticket machines used at branches. These machines are in constant synchronization with the CMS via the network.
Instant Updates
All updates made centrally are delivered to the branches within just 2 seconds. In this way, branches are immediately informed about central changes and are automatically updated.
Smart Data Transmission
Ticket machines, branch performance, initiated tickets, queue statuses, and staff work information are critical data points that are instantly transmitted to the central coordination point. This dynamic approach ensures that operations are carried out efficiently and effectively.
Single Point Management
You can manage ticket distributions, queue setups, and even advertisements from a single point through the system. This provides a consistent, fast, and seamless execution of processes.

Flexible Compatibility
Offers a flawless experience on every platform, from desktops to mobile devices, in both horizontal and vertical screen layouts.
Access Everywhere
Manage your system from anywhere using standard web browsers. Easily perform many operations such as live reports, ticket template changes, adding new queues, or staff permission arrangements.
No Application Required
You do not need to download any application to access our system. Full integration with your standard web browsers provides a fast and efficient management experience.
Integrated Display
With tracking tools compatible with Smart and LCD TVs, monitor the live status of all your branches and equipment in your operation center.
Real-Time Information
Instantly display and inform about the current situations in all your branches through TV monitoring tools.
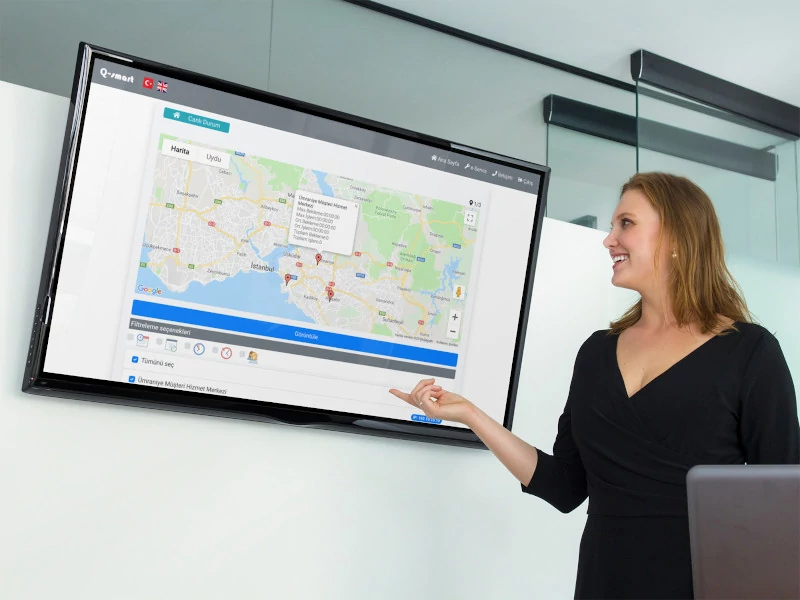
Detailed Mapping
Access the location information of your equipment with up-to-date map details thanks to Google Maps integration. Whether within an individual building, across Turkey, or even globally, observe all your systems on a single screen. Experience a monitoring experience customized to your needs with the ability to adjust the starting position and zoom level.
Live Location Information
The central system management displays the technical and performance status of each branch in real-time on the map through built-in map integration.
Detection and Notification
Automatically detects anomalies such as unusually long transaction or wait times. It identifies branches that exceed the wait time limit or have longer than expected service times and directs this information to the relevant managers.
Customizable User Experience
You can customize details such as the map scanning speed, zoom level, which data and branches will be displayed, and information update frequencies according to user preferences, thereby experiencing a fully personalized map monitoring experience.

Cross-Branch Comparisons
Access detailed data to compare the efficiency and performance of your branches. Evaluate each branch’s, queue’s, and staff’s work against the overall system performance.
Time-Based Analyses
Whether hourly, daily, weekly, monthly, or annually; examine detailed performance reports for the time period of your choice.
Density Notification
Access concrete information about your work density to determine your busiest hours, days, and months. With this information, you can make more efficient plans and adjustments.
Flexible Sorting and Display
With advanced table technology, you can quickly sort and display your reports according to the criteria you desire.
Export Options
Export your reports in various formats:
- Excel: The ability to export data for analysis and processing in Excel format.
- PDF: Export in PDF format for professional reports and presentations.
- Table: Export in standard table format to increase compatibility with other programs.
- Printable: An optimized format for printing reports directly from a printer.
- Clipboard: The option to directly copy data and share it across different platforms.
These extensive transfer options provide flexibility in processing your data on the platform of your choice.
Live Graphic Changes
With an advanced dynamic graphics library, you can quickly change graphic types (line, bar, horizontal bar, pie, and more) on the fly.
Flexible Report Modification
- Add/Remove Branch: You can add or remove branches of interest from the report and observe these changes instantly.
- Detailed View: By clicking or hovering over each data point in the graphic, you can get detailed information about the related data.
These interactive tools help make your reports more meaningful, enlightening, and user-friendly, allowing you to make more effective and informed decisions in your data analysis.